
← Back to Optimization Tips
Homelab Power Monitoring: Prometheus + Grafana Guide (2026)
Build a real-time power monitoring dashboard using Prometheus, Grafana, and smart plugs. Track costs, identify energy vampires, and optimize homelab consumption.
Published Jan 19, 2026Updated Feb 10, 2026
grafanamqttpower-monitoringprometheusshellysmart-plugtasmota
Homelab Power Monitoring: Prometheus + Grafana Guide (2026)
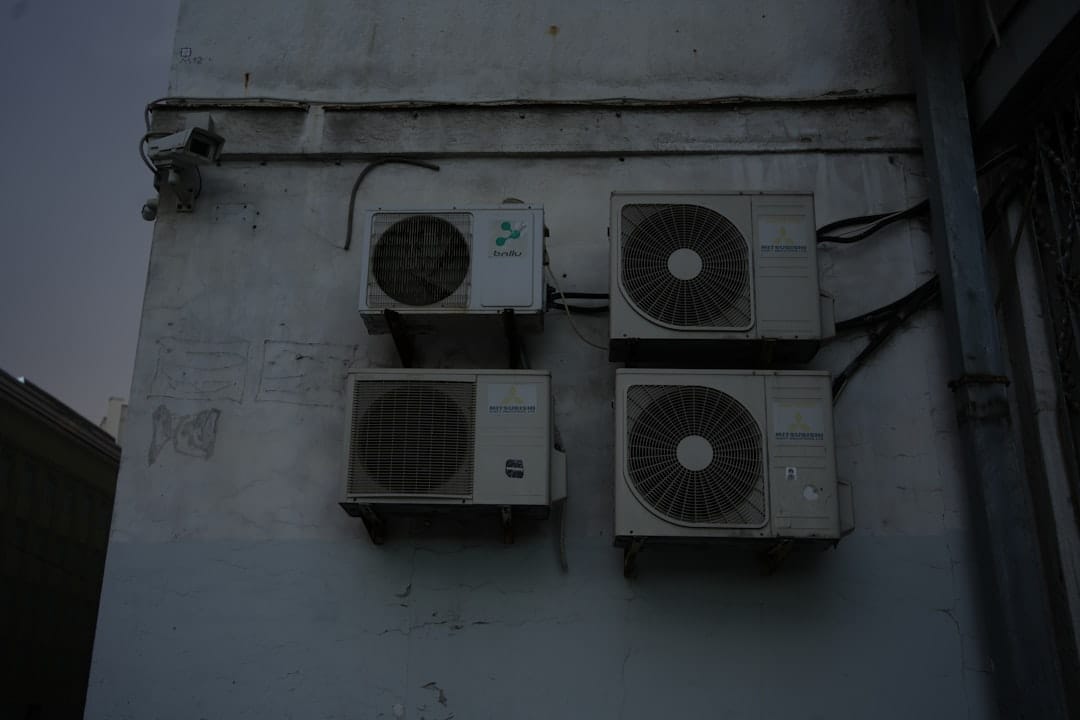
Ever wondered exactly how much electricity your homelab consumes? Beyond simple kill-a-watt readings, building a real-time power monitoring dashboard gives you continuous visibility into your energy usage, helps identify power-hungry devices, and enables data-driven optimization decisions.
This guide walks you through creating a complete power monitoring stack using Prometheus, Grafana, and smart plugs. By the end, you'll have beautiful dashboards tracking every watt your servers consume.
Why Monitor Your Homelab Power?
Before diving into the technical setup, let's understand why power monitoring matters for home server enthusiasts.
The Real Cost of Running Servers
A typical homelab might consume 50-200W continuously. At $0.12/kWh (US average), that's:
| Daily Consumption | Monthly Cost | Annual Cost |
|---|---|---|
| 50W (efficient) | $4.32 | $52 |
| 100W (moderate) | $8.64 | $104 |
| 200W (heavy) | $17.28 | $207 |
Understanding exactly where those watts go helps you make informed decisions about hardware upgrades and usage patterns.
Benefits of Continuous Monitoring

Identify Energy Vampires: Discover which devices consume more than expected. That "idle" gaming PC might be drawing 80W instead of the expected 20W.
Track Usage Patterns: See how power consumption varies with workloads. Media transcoding, backups, and AI inference all have distinct power signatures.
Validate Optimizations: When you apply power-saving tweaks, verify they actually work with hard data.
Cost Attribution: If you run services for family or friends, understand the true cost of each service.
Anomaly Detection: Sudden power spikes might indicate hardware issues or runaway processes.
The Monitoring Stack Overview
Our power monitoring solution consists of three main components:
Smart Plug (Shelly/Tasmota)
    ↓ (HTTP/MQTT)
Prometheus (Time-Series Database)
    ↓ (PromQL)
Grafana (Visualization)
Smart Plugs: Hardware devices that measure actual power consumption and expose metrics via HTTP or MQTT.
Prometheus: A time-series database that scrapes and stores metrics from your smart plugs at regular intervals.
Grafana: A visualization platform that queries Prometheus and renders beautiful, interactive dashboards.
Hardware: Choosing Your Smart Plugs
The foundation of power monitoring is hardware that can measure watts accurately and expose data programmatically.
Recommended Smart Plugs Comparison
| Smart Plug | Price | Features | Firmware | Best For |
|---|---|---|---|---|
| Shelly Plug S | $20 | Native REST API, 12A | Stock | Beginners, no flash needed |
| Shelly Plus Plug S | $22 | ESP32, better Wi-Fi | Stock | 2024+ purchases |
| Sonoff S31 | $12 | Requires flashing | Tasmota | Budget builds |
| Athom Pre-flashed | $18 | Ships with Tasmota | Tasmota | Skip flashing hassle |
| TP-Link Kasa HS110 | $25 | Energy monitoring | Stock | Existing Kasa users |
Shelly vs Tasmota: Which to Choose?
Choose Shelly if:
- You want plug-and-play setup
- Native REST API is sufficient
- You prefer official firmware support
- Time is more valuable than $5-10 savings
Choose Tasmota if:
- You enjoy tinkering and customization
- You want MQTT integration
- You already have Tasmota devices
- You're comfortable with firmware flashing
Power Rating Considerations
For server monitoring, consider the maximum power draw:
- Single mini PC: 5-65W → Any 10A plug works
- Full desktop server: 200-500W → Use 15A rated plug
- Multiple devices on power strip: Sum wattages → Consider multiple plugs
Pro Tip: Never exceed 80% of a plug's rated capacity for continuous loads. A 10A/1200W plug should handle no more than 960W continuous.
Setting Up Shelly Plugs
Shelly plugs offer the easiest path to power monitoring with their native HTTP API.
Initial Configuration
-
Connect to Shelly's Setup Network
- Power on the plug
- Connect to the
ShellyPlus-XXXXWiFi network - Open
192.168.33.1in your browser
-
Configure Your WiFi
- Go to Settings → WiFi
- Enter your network credentials
- The plug will reboot and join your network
-
Find the IP Address
- Check your router's DHCP leases
- Or use
nmap -sn 192.168.1.0/24 | grep -i shelly
-
Enable the HTTP API
- Navigate to Settings → API
- Ensure "Enable API" is checked
- Note: Shelly Gen2 devices use a different API format
Testing the Shelly API
For Shelly Gen1 (Plug S):
# Get current power reading
curl http://192.168.1.100/meter/0

# Response example:
{
  "power": 45.23,
  "is_valid": true,
  "total": 12345.67
}
For Shelly Gen2 (Plus Plug S):
# Get switch status with power data
curl http://192.168.1.100/rpc/Switch.GetStatus?id=0

# Response example:
{
  "id": 0,
  "output": true,
  "apower": 42.5,
  "voltage": 121.3,
  "current": 0.352,
  "aenergy": {"total": 1234.56}
}
Setting Up Tasmota Plugs
Tasmota offers more flexibility but requires initial flashing.
Flashing Tasmota (Sonoff S31 Example)
Required Tools:
- USB-to-Serial adapter (3.3V logic)
- Soldering iron (for header pins)
- Computer with Python
Flashing Steps:
-
Prepare Hardware
- Open the Sonoff S31 carefully
- Solder header pins to the programming pads
- Connect TX→RX, RX→TX, GND→GND, 3.3V→VCC
-
Download and Flash
# Install esptool pip install esptool # Download Tasmota firmware wget https://github.com/arendst/Tasmota/releases/download/v13.4.0/tasmota.bin # Flash (hold GPIO0 button while powering on) esptool.py --port /dev/ttyUSB0 write_flash -fs 1MB 0x0 tasmota.bin -
Configure Tasmota
- Connect to
tasmota-XXXXWiFi - Set your WiFi credentials
- Configure device template for Sonoff S31
- Connect to
Enabling Prometheus Metrics in Tasmota
Add these commands via the Tasmota console:
# Enable web server metrics endpoint
SetOption123 1

# Alternatively, use the /metrics endpoint
# Available at: http://tasmota-ip/metrics
Testing Tasmota Metrics
curl http://192.168.1.101/metrics

# Response (Prometheus format):
# HELP tasmota_energy_power_active_watts Active power in watts
# TYPE tasmota_energy_power_active_watts gauge
tasmota_energy_power_active_watts 42.3
# HELP tasmota_energy_total_kwh Total energy in kWh
tasmota_energy_total_kwh 123.456
Deploying Prometheus
Prometheus collects and stores time-series metrics from your smart plugs.
Docker Compose Setup
Create a docker-compose.yml file:
version: '3.8'

services:
  prometheus:
    image: prom/prometheus:v2.50.1
    container_name: prometheus
    restart: unless-stopped
    ports:
      - "9090:9090"
    volumes:
      - ./prometheus.yml:/etc/prometheus/prometheus.yml:ro
      - prometheus_data:/prometheus
    command:
      - '--config.file=/etc/prometheus/prometheus.yml'
      - '--storage.tsdb.path=/prometheus'
      - '--storage.tsdb.retention.time=90d'
      - '--web.enable-lifecycle'

  grafana:
    image: grafana/grafana:10.3.3
    container_name: grafana
    restart: unless-stopped
    ports:
      - "3000:3000"
    volumes:
      - grafana_data:/var/lib/grafana
    environment:
      - GF_SECURITY_ADMIN_PASSWORD=your_secure_password
      - GF_USERS_ALLOW_SIGN_UP=false
    depends_on:
      - prometheus

volumes:
  prometheus_data:
  grafana_data:
Prometheus Configuration
Create prometheus.yml alongside your docker-compose file:
global:
  scrape_interval: 15s
  evaluation_interval: 15s

scrape_configs:
  # Prometheus self-monitoring
  - job_name: 'prometheus'
    static_configs:
      - targets: ['localhost:9090']

  # Shelly Gen1 plugs (using JSON exporter or direct metrics)
  - job_name: 'shelly_plugs'
    metrics_path: /metrics
    static_configs:
      - targets: ['192.168.1.100:80']
        labels:
          device: 'home-server'
          location: 'office'
      - targets: ['192.168.1.101:80']
        labels:
          device: 'nas'
          location: 'closet'

  # Tasmota plugs (native Prometheus metrics)
  - job_name: 'tasmota_plugs'
    metrics_path: /metrics
    static_configs:
      - targets: ['192.168.1.102:80']
        labels:
          device: 'network-switch'
          location: 'rack'
Using a Shelly Exporter
For Shelly devices without native Prometheus support, use a dedicated exporter:
# Add to docker-compose.yml
  shelly-exporter:
    image: ghcr.io/trickest/shelly-plug-prometheus:latest
    container_name: shelly-exporter
    restart: unless-stopped
    ports:
      - "9784:9784"
    environment:
      - SHELLY_HOSTS=192.168.1.100,192.168.1.101
Then add to prometheus.yml:
  - job_name: 'shelly_exporter'
    static_configs:
      - targets: ['shelly-exporter:9784']
Starting the Stack
# Start all services
docker-compose up -d

# Check status
docker-compose ps

# View Prometheus targets
open http://localhost:9090/targets
Verify all targets show as "UP" in the Prometheus targets page.
Building Your Grafana Dashboard
Now for the fun part—creating beautiful visualizations of your power data.
Initial Grafana Setup
- Access Grafana: Open
http://localhost:3000 - Login: Use admin / your_secure_password
- Add Data Source:
- Go to Configuration → Data Sources → Add data source
- Select Prometheus
- URL:
http://prometheus:9090 - Click "Save & Test"
Essential Dashboard Panels
Panel 1: Real-Time Power Gauge
Create a gauge showing current total power:
sum(tasmota_energy_power_active_watts)
Settings:
- Visualization: Gauge
- Unit: Watts (W)
- Thresholds: 0=green, 100=yellow, 200=red
Panel 2: Power by Device
A bar chart showing power per device:
tasmota_energy_power_active_watts
Settings:
- Visualization: Bar chart
- Legend:
{{device}} - Unit: Watts (W)
Panel 3: 24-Hour Power History
Line chart showing historical consumption:
sum(tasmota_energy_power_active_watts)
Settings:
- Visualization: Time series
- Time range: Last 24 hours
- Fill opacity: 20%
Panel 4: Daily Energy Consumption
Calculate daily kWh usage:
increase(tasmota_energy_total_kwh[24h])
Settings:
- Visualization: Stat
- Unit: Kilowatt-hours (kWh)
- Color mode: Value
Panel 5: Estimated Monthly Cost
Calculate projected monthly electricity cost:
(sum(rate(tasmota_energy_total_kwh[1h])) * 24 * 30) * 0.12
Replace 0.12 with your local electricity rate per kWh.
Settings:
- Visualization: Stat
- Unit: Dollars ($)
- Title: "Projected Monthly Cost"
Panel 6: Power Usage Heatmap
Visualize usage patterns across days and hours:
sum(tasmota_energy_power_active_watts) by (hour)
Settings:
- Visualization: Heatmap
- Y-axis: Day of week
- X-axis: Hour of day
Importing Pre-Built Dashboards
Save time with community dashboards:
- Go to Dashboards → Import
- Enter dashboard ID or paste JSON
- Popular IDs for power monitoring:
- 15762: Shelly Plug monitoring
- 14857: Tasmota power dashboard
- 12833: General energy monitoring
Advanced: Alerting on Power Anomalies
Set up alerts to catch unusual power consumption.
Grafana Alert Rules
Go to Alerting → Alert Rules → Create alert rule:
High Power Alert:
sum(tasmota_energy_power_active_watts) > 300
- Evaluate every: 1m
- For: 5m
- Notification: Email/Slack/Discord
Device Offline Alert:
up{job="tasmota_plugs"} == 0
- Evaluate every: 1m
- For: 2m
- Notification: Immediate
Unusual Spike Detection:
sum(tasmota_energy_power_active_watts) >
  avg_over_time(sum(tasmota_energy_power_active_watts)[7d:1h]) * 1.5
- Triggers when current power exceeds 7-day average by 50%
Setting Up Notification Channels
- Go to Alerting → Contact points
- Add notification method:
- Email: Configure SMTP settings
- Discord: Add webhook URL
- Slack: Add incoming webhook
- Pushover: Add API token
Real-World Power Insights
Here's what homelab users typically discover with power monitoring:
Common Findings
NAS Power Patterns:
- Idle: 15-30W (drives spin down)
- Active: 40-80W (depending on drive count)
- Peak: 100W+ (all drives spinning up simultaneously)
Mini PC Servers:
- N100 idle: 6-10W
- N100 under load: 15-25W
- Mac Mini M1 idle: 5-7W
Network Equipment:
- Managed switch: 10-30W
- Unmanaged switch: 3-8W
- Router/firewall: 5-15W
Optimization Opportunities Discovered
Users commonly find:
- Scheduled tasks: Backups running at peak electricity rates
- Idle efficiency: Devices not entering low-power states
- Vampire loads: USB hubs, chargers, and peripherals consuming 5-10W each
- Cooling costs: Fans running at full speed unnecessarily
Alternative Approaches
Not every setup needs Prometheus and Grafana. Consider these alternatives:
Simpler Solutions
| Approach | Complexity | Features | Best For |
|---|---|---|---|
| Kill-A-Watt | Low | Basic readings | Quick checks |
| Shelly App | Low | Basic history | Single device |
| Home Assistant | Medium | Full automation | HA users |
| This stack | Medium | Full analytics | Data enthusiasts |
| InfluxDB + Grafana | Medium | Better compression | Long retention |
Home Assistant Integration
If you already run Home Assistant, integrate your smart plugs there instead:
# configuration.yaml
sensor:
  - platform: integration
    source: sensor.shelly_power
    name: "Server Energy"
    unit_prefix: k
    round: 2
Troubleshooting Common Issues
Prometheus Not Scraping
Symptoms: Targets showing as "DOWN"
Solutions:
- Verify smart plug IP addresses
- Check firewall rules (port 80 from Docker network)
- Test with
curl http://plug-ip/metrics - Verify Docker network connectivity
Missing Metrics
Symptoms: Some metrics not appearing
Solutions:
- Ensure correct Prometheus job configuration
- Check metric names (vary by firmware version)
- Verify scrape interval allows data collection
- Check for relabeling issues
Grafana Shows No Data
Symptoms: Panels empty or showing "No data"
Solutions:
- Verify Prometheus data source is working
- Check time range selection
- Test query in Prometheus UI first
- Ensure metric names match exactly
Inaccurate Power Readings
Symptoms: Reported watts don't match expectations
Solutions:
- Smart plugs may have ±5% accuracy—this is normal
- Compare with known reference (kill-a-watt)
- Calibrate if firmware supports it
- Check for power factor issues with non-resistive loads
FAQ
How accurate are smart plug power readings?
Most smart plugs are accurate within ±2-5% for resistive loads. For inductive loads (motors, compressors) or switching power supplies, accuracy may decrease due to power factor considerations. For homelab monitoring, this accuracy is generally sufficient.
Can I monitor multiple circuits with one Prometheus instance?
Yes! Prometheus can scrape hundreds of targets. Simply add more smart plugs to your prometheus.yml configuration with appropriate labels to distinguish between circuits, rooms, or devices.
How long should I retain power data?
For most homelabs, 90 days provides enough history for trend analysis while keeping storage requirements reasonable. Prometheus typically uses 1-2 bytes per sample, so a year of 15-second resolution data for 10 devices requires about 2GB.
Is there a way to monitor without smart plugs?
Some options:
- PDU with monitoring: Server-grade PDUs report per-outlet power
- Current transformers (CTs): Clamp around cables for non-invasive measurement
- Whole-home monitors: Sense, Emporia, IoTaWatt for circuit-level monitoring
- UPS monitoring: Many UPS units report power draw via USB/network
Can I use this setup with solar panels?
Absolutely! Monitor your solar production alongside consumption to calculate net usage. Some users create dashboards showing production vs consumption, with alerts when consumption exceeds production.
Conclusion
Building a Prometheus + Grafana power monitoring stack transforms vague assumptions about electricity usage into concrete, actionable data. Within a few hours of setup, you'll have:
- Real-time visibility into exactly where your watts go
- Historical trends showing usage patterns over days, weeks, and months
- Cost tracking with projected monthly bills based on actual consumption
- Anomaly detection alerting you to unusual power events
The investment in monitoring often pays for itself through discovered optimization opportunities. Many homelab users report finding 20-50W of unnecessary consumption—devices left on, inefficient configurations, or unexpected power draws.
Start with a single smart plug on your primary server, then expand as you discover the value of granular power data. Your future self (and electricity bill) will thank you.
Additional Resources
You may also like

Optimization
Lightweight Server Monitoring: Beszel vs Uptime Kuma vs Grafana (2026)
Compare Beszel, Uptime Kuma, and Grafana for low-power home servers. Resource usage benchmarks, Docker setup guides, and which monitoring tool to choose.
beszelgrafanalow-power

Optimization
Supercharge Your Home Server with Redis Caching and RAM Drives (2026)
Put your idle RAM to work: add Redis caching for 6x faster Nextcloud page loads and configure tmpfs RAM drives to eliminate Jellyfin transcode SSD writes. Step-by-step Docker setup included.
cachingnextcloudperformance

Optimization
Linux Power Tuning for Sub-15W Idle Home Servers (2026 Guide)
Step-by-step Linux power optimization workflow to reduce home server idle draw with BIOS C-states, ASPM, PowerTOP, and device-level tuning.
c-stateslow-powerpower
Related Tools
Want to measure your improvements?
Use our Power Calculator to see how much you can save.
Try Power Calculator